The three entities received a set of three technical assistance workshops and three webinars that were held between September 2017 and January 2018.
This support was designed to develop strategies for collaborating with TDOT (Tennessee Department of Transportation) and implementing, funding, and supporting Complete Streets.
Nashville, Chattanooga, and Knoxville each hosted one of the workshops, tailored to the region’s specific opportunities and challenges to Complete Streets implementation. The workshops provided participants with tools and strategies to implement Complete Streets that advance economic, health, and community vibrancy goals.
To compile the data used for these infographics TPO staff verified crash locations and assigned crash factors based on information obtained from individual crash reports, including crash narratives and information about citations issued.
In addition to the infographics, this data can also be viewed on an interactive map that was released last fall. It allows users to explore information specific to the type of crash, crash factors and an overview of all the data.
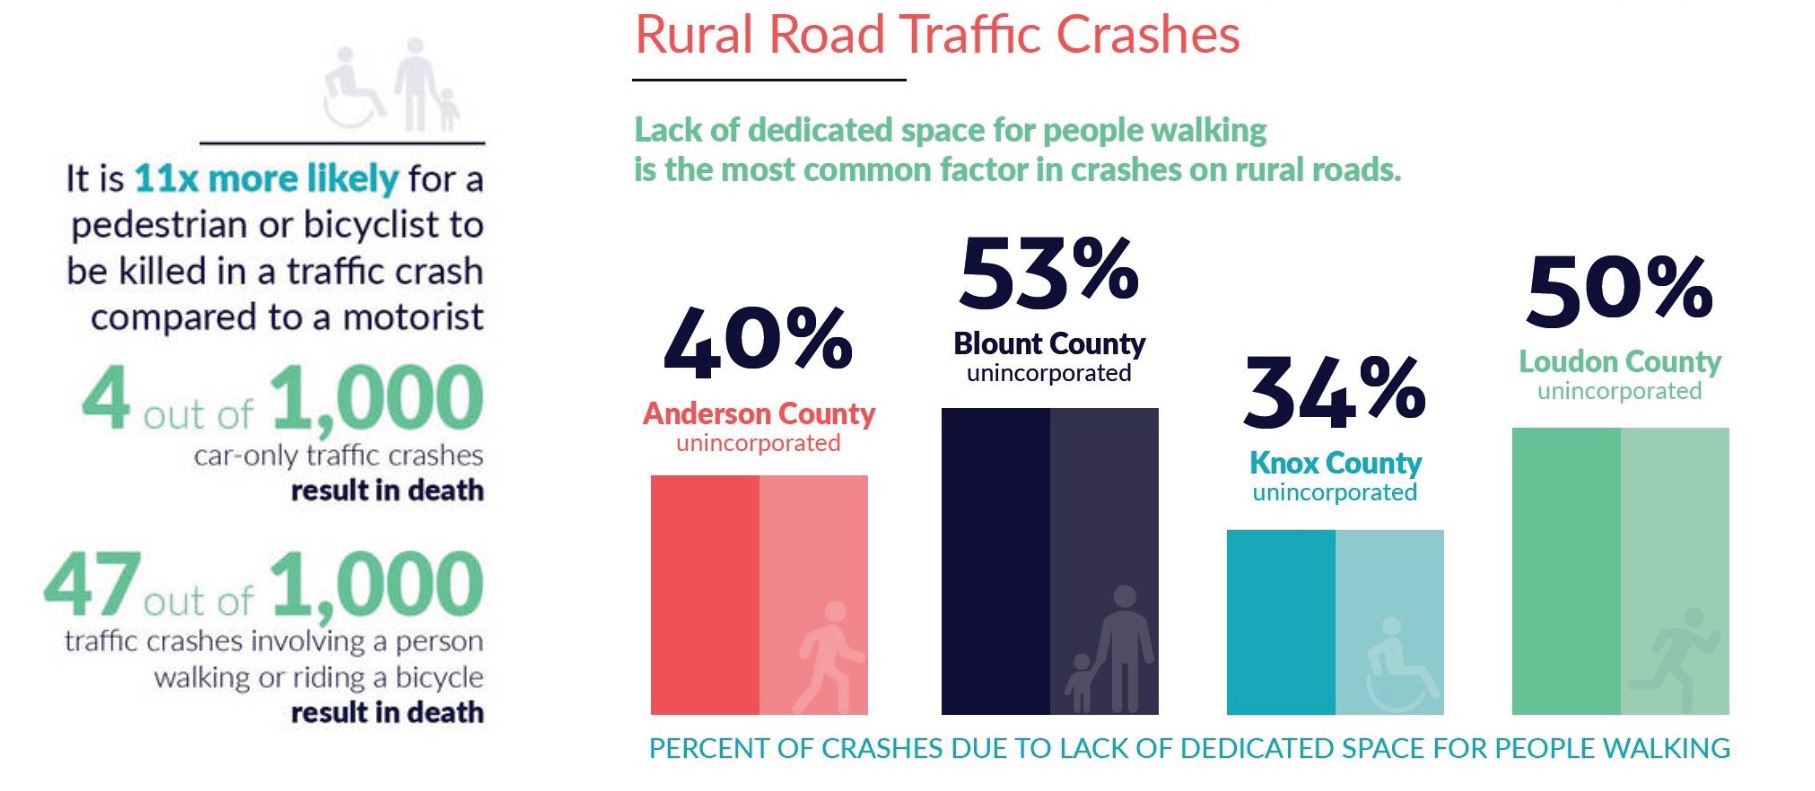
On rural roads, lack of sidewalks is the most common factor in crashes involving people walking or riding bicycles. The footpath that runs alongside the road pictured here makes it clear that a sidewalk is needed.
This data is important to the TPO’s work because 90 percent of the crashes recorded from this five year period resulted in injury or death of a person walking or bicycling. The goal in identifying and analyzing the information is to prevent future crashes through engineering, education, and enforcement.
Solutions
Local solutions are being found for some of the issues presented. In the Knoxville Region, 39 percent of traffic crashes that involve bicyclists and 48 percent of those involving pedestrians are caused by a motorist failing to yield when making a turn. After identifying a high number of these crashes, the City of Knoxville banned right turns on red at the intersection of Cumberland Ave. and Melrose Place.
The pedestrians shown here are unable to cross the road, despite having a walk signal, due to traffic failing to yield.
Another solution is the use of a Leading Pedestrian Interval (LPI), like the one that has been installed at the traffic signal at the intersection of Downtown West Boulevard and Ray Mears Boulevard. This technology gives pedestrians the walk signal three to seven seconds before motorists get the green light to proceed through the intersection, allowing walkers to establish their presence in the crosswalk ahead of motor vehicles.
A National Issue
National attention has been given to some of the same issues presented in these infographics. A recent news article reports that allowing right turns on red increases the risks of injury and death to those walking or riding a bicycle. Another article states that the number of people who die in a traffic crash while walking has risen significantly over the last decade, and that most of those crashes are occurring on arterial streets. The National Transportation Safety Board studied the dangers of speeding and found that 31 percent of traffic fatalities are speed related.
Your eyes aren’t deceiving you – the Smoky Mountains can be seen more clearly and more often thanks to recent air quality improvements.
July 2004
July 2016
A picture is worth a thousand words. Images from the Look Rock Observation Tower compare conditions in the months of July 2004 and 2016. Daily ozone levels peak during summer months, causing hazy and smoggy conditions. Thanks to successful efforts to reduce airborne pollutants, improved clarity of the atmosphere between these periods is striking and shows dramatic effect on visibility on an every-day basis. Source: National Park Service
Major improvements to air quality over the last several years mean that the East Tennessee region is now meeting all Environmental Protection Agency (EPA) standards. And that’s very important for the health of both our residents and our economy.
Over the last several decades, the Knoxville region has been out of compliance with EPA standards for two pollutants – ozone and particulate matter – and was officially designated a ‘non-attainment area.’ That designation carried a heavy cost: it meant the air was sometimes unhealthy to breathe and it kicked in federal restrictions on some types of new business recruitment, detrimental to the regional economy.
Most air pollution is from man-made sources, especially transportation (vehicle tailpipe and fuel evaporation emissions) and industry (manufacturing and power generation involving combustion). Investments by power generators, such as TVA, and technological improvements to vehicle fleets have resulted in pollutant reduction.
Results of our efforts to comply with Clean Air Act standards can be seen in some pretty impressive stats: in 1999, we exceeded ozone limits (70 parts per billion) on more than 120 days. In 2017, that number dropped to just one day.
This chart shows the number of days each year since 1997 that monitoring equipment in the Knoxville region recorded pollution that exceeded the federal eight-hour ozone standard. Source: Air Data. EPA
While EPA attainment status is critically important in ensuring clean air to breathe, increased visibility has another big benefit to many people. Our region relies on its natural beauty and views, both of and from the Great Smoky Mountains National Park, for our own enjoyment as well as for the major economic impact as a driver of tourism.
Average visibility distances from the Smokies have been gauged since 1990. Tremendous and sustained improvement has been measured since 2007 — on a typical day, Mount LeConte is now visible from many parts of the region.
Dramatic increases in visibility, particularly in the last 10 years, mean that the Smoky Mountains are again visible from downtown Knoxville, 35 miles away. Source: Interagency Monitoring of Protected Environments
Others have taken notice of our improved air quality, evidenced by a recent article published by the American Lung Association. They spotlight the success of Knoxville in cleaning up its air and offer details about the process that made such significant progress possible.
Realtime Visibility and Pollutant Conditions from Look Rock
A new, interactive map created by MPC/TPO staff shows the factors that contribute to crashes and location trends across the region. Over 1400 crashes from seven area law enforcement agencies are included.
The Knoxville Regional Transportation Planning Organization (TPO) has embarked upon another annual traffic count update for the Knoxville region.
This area encompasses 11 counties: Anderson, Blount, Cocke, Grainger, Hamblen, Jefferson, Knox, Loudon, Roane, Sevier, and Union. The TPO compiles annual traffic counts from Tennessee Department of Transportation (TDOT) and a private contractor. While TDOT records counts from all 11 counties, the private contractor only counts in Blount, Knox, and Loudon counties.
This year there are some notable updates. TDOT added several new traffic count stations, and many are very close to count stations operated by the private contractor. This will free up resources for the contractor to place stations in new and previously discontinued locations. Many of the discontinued locations were abandoned in 2009 when the City of Knoxville decided to terminate its traffic count program.
With this change, TPO came up with a system to display the replaced and discontinued traffic count stations on TPO's traffic count page and KGIS Maps. There are now semi-transparent red X’s to show where the stations once were. Just like the active count stations, you can click on a discontinued station to view a chart of historical traffic count data. Files of all the count stations within the 11 county region are available for download.
TPO staff has compiled data on crashes involving pedestrians and bicyclists throughout the region. Below is a link to a map of the crashes, followed by reports including a regional summary of crashes, as well as reports for multiple jurisdictions analyzing patterns in crash locations and circumstances. The reports are followed by infographics with some select data in a more digestible format. View the Map
The Workforce Housing report examines challenges associated with providing adequate housing for Knox County's working families, including transportation costs.
In Knox County many working households are spending more money on housing and transportation than they can afford. The housing market is not supplying enough affordable units, so households have fewer choices and are often left spending more than 45% of their income on housing and transportation expenses.
As of July 1, 2016, several changes related to garage and street parking took effect in certain parts of Knoxville.
With a focus on downtown and Fort Sanders, the City and Public Building Authority (PBA) are increasing enforcement, adjusting rates, and installing new meters. With all of this, monthly parking fees for garage parking will see a slight increase, most meters will have slightly higher fees and now include Saturdays, and there will be more officers to police these changes.